
The KPIs that keep a program honest
A status color hides. A number can't. The measurement system that keeps a large ERP, CRM or service management program honest from kickoff through hypercare, and the go-live metrics that tell you the truth before the org does.
I've watched a lot of programs report themselves healthy right up until the week they weren't. The status was green, the milestones were "on track" and the steering deck had a comforting row of amber trending green. Then a data conversion missed its window, or the first live payroll ran wrong, or a division quietly went back to spreadsheets, and everyone in the room found out the program had been red for 2 quarters. Nobody lied. The reporting drifted, the way reporting does when it's a color instead of a number.
There's research behind that drift. A study in MIT Sloan Management Review found that status reports on troubled IT projects are biased about 60% of the time, and the bias runs roughly two to one toward optimism. The executives receiving those reports mostly couldn't tell.
A green light told them nothing, and they had no way of knowing it told them nothing. That's the case for measuring instead of coloring: better numbers, chosen in advance, produced on a cadence, shown as trends and owned by name. A KPI framework earns its place when it lets a program leader, a sponsor or an independent set of eyes see the truth early enough to still do something about it.
None of this is specific to one platform. Whether you're standing up Workday, SAP S/4HANA, Oracle Fusion, Salesforce or ServiceNow, the numbers that predict success are the same.
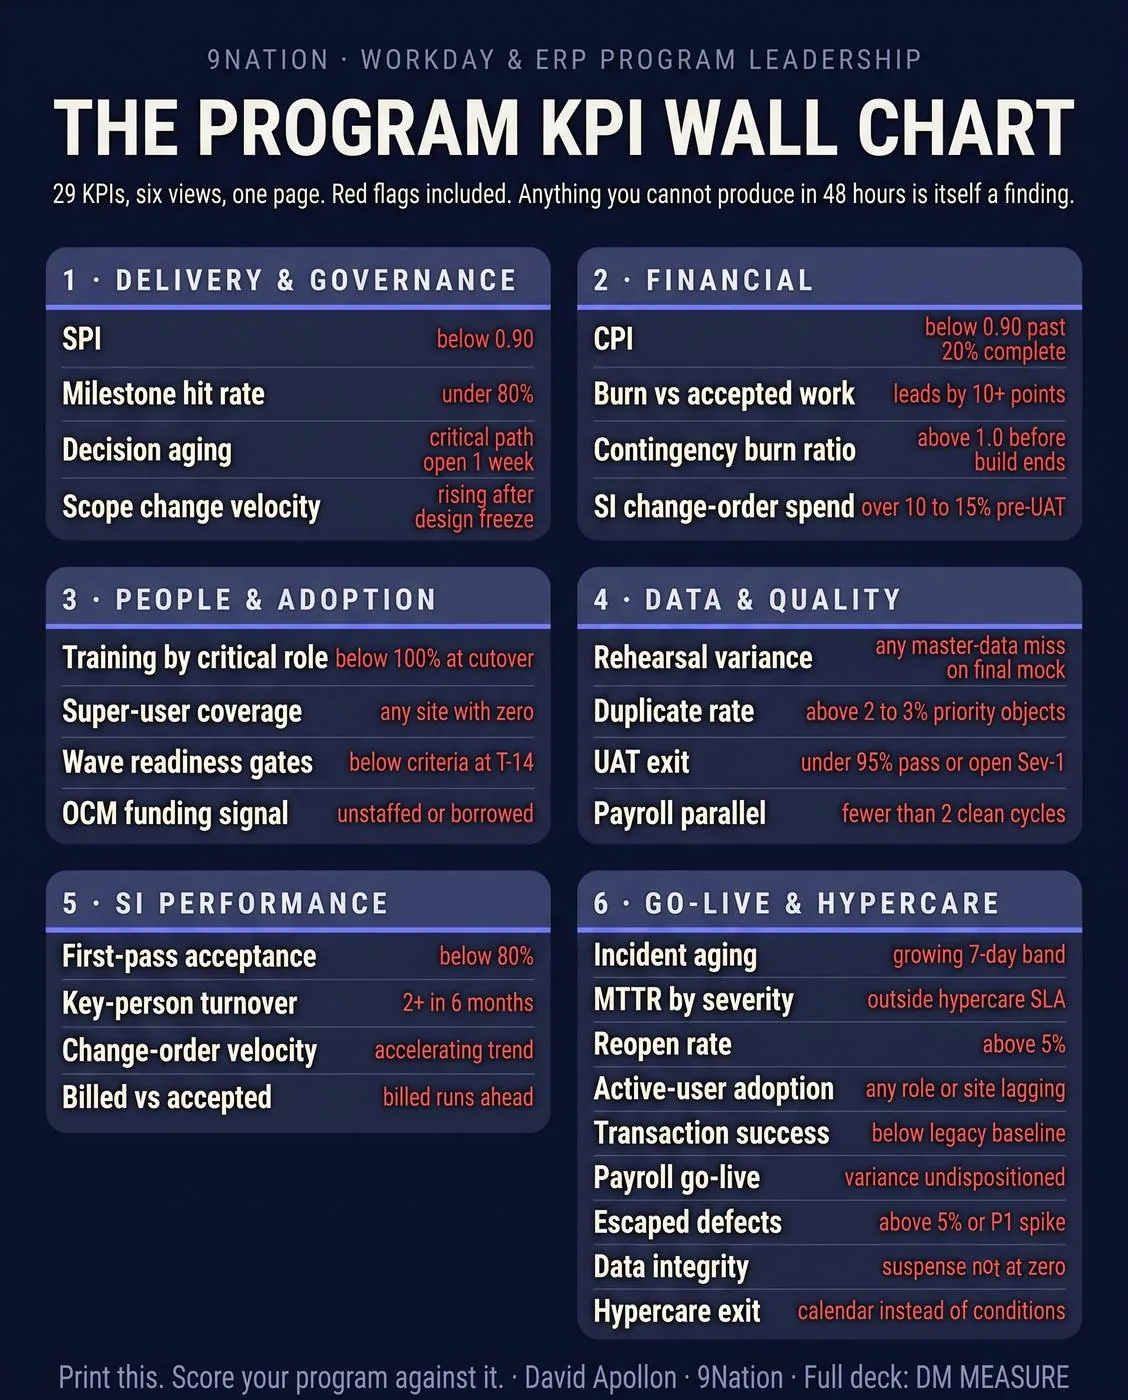
Twenty-nine KPIs, and the line where each one turns red
Five views run a program up to go-live and a sixth takes over the day you cut over. Each KPI has a formula, a red-flag threshold, an owner and a cadence, so no single number can hide a program. A green schedule can't cover a red budget. Strong adoption can't excuse dirty data.
0.90 Large: the five I'd put on one slide. words Italic: a red flag stated in words.
- below0.90Schedule Performance IndexEarned work divided by planned workProgram lead · weekly
- misses in a row2Milestone hit rateAgainst the baseline dates. A date quietly reset last month doesn't count.Program lead · weekly
- open past14 daysDecision agingDecisions open past 14 days, plus the average days to decidePMO · weekly
- below0.90Cost Performance IndexEarned value over actual costFinance lead · monthly
- burn ahead of acceptance by10 pointsBurn against accepted deliverablesBudget spent against work formally accepted, whatever the calendar saysFinance lead · monthly
- critical roles under90%Training completion by roleWeighted to go-live-critical roles, never a flattering all-user averageChange lead · weekly
- any site at0Super-user coverageNamed, trained super users per site or departmentChange lead · biweekly
- red whenamber at the final gateWave readinessAgainst gate criteria at set intervals before each cutoverChange lead · per gate
- red whenflat or fallingUtilization and proficiencyAfter go-live. Completion measures exposure; this measures capability.Change lead · after go-live
- at the final mock, over2%Duplicate rate, priority objectsOn the objects that carry compliance exposure, worker and pay firstBusiness data owner · per mock
- on the final mock, over2%Rehearsal varianceAt least three full mock loads, with Finance reconciling control totals to the dollarBusiness data owner · per mock
- red whenany critical is openUAT exit qualityDefects found in user testing are the expensive kind. These are exit criteria.Test lead · per gate
- red whena falling trendFirst-pass acceptanceShare of deliverables accepted without reworkVendor manager · monthly
- red whenacceleratingChange-order velocitySI-originated changes per month, in count and dollars. Watch the acceleration more than the level.Vendor manager · monthly
- red when it hitsany named roleKey-person turnoverAgainst the roles named in the contractVendor manager · monthly
- red whenbilled runs aheadBilled against acceptedWhen billing runs ahead of acceptance, you're financing the integrator's optimismVendor manager · monthly
- open past7 daysIncident agingBuckets at 24 hours, 72 hours and 7 days. Exit gates watch the 7-day band.
- red whenoutside the hypercare SLATime to resolve, by severityTotal resolution time over tickets resolved, with acknowledge and resolve timed separately
- at or over5%Reopen rateReopened tickets over resolved. Under 5% says fixes are sticking.
- red whena department far belowActive users, by role and sitePeople doing real work in the system, web and mobile
- red whenfar below the old baselineTransaction throughputAgainst the pre-go-live baseline. Low volume means users found a way around you.
- red ona sharp drop below legacyClean-match rate, procure to payA drop usually means match tolerance or master data
- clean parallels in a row, fewer than2Net-pay match, parallel runsEmployees inside tolerance across consecutive parallel cycles
- accuracy under99%First live payrollAcross all pay elements, and on time
- a swing over10%Net pay, per employeePeriod over period. Anything past it gets a manual review before the run releases.
- leakage over5%Escaped defectsDefects found in production over total defects
- red ata penny offOpening balancesPost-migration opening balances against legacy closing balances, on financials
- red whenstill above zeroSuspense and clearing accountsWatched daily. A climbing balance is the earliest hard signal of a mapping or interface defect.
- red whenset by the calendarHypercare exitMeasured conditions, written down before go-live
Why the color lies and the number doesn't
A McKinsey study with the University of Oxford, drawn from more than 5,400 large IT projects, found they run 45% over budget on average and deliver 56% less value than predicted. Those were the ordinary ones. The black swans that blow past 200% overrun were a separate 17% on top.
The pattern hasn't aged out. Gartner projects that by 2027 more than 70% of recently implemented ERP initiatives will fail to fully meet their original business goals. Note the wording: the yardstick is the goals that justified the spend. Panorama Consulting's 2026 ERP Report found more than a quarter of implementations went over budget and nearly a quarter over schedule. The leading schedule cause was organizational, meaning governance gaps, change resistance, delayed sign-offs and unplanned change orders.
That's the whole argument for a real KPI system. Technology is rarely what sinks these programs. They fail on decisions made late, data trusted too early, adoption assumed instead of measured, and vendor performance nobody held to a number. Every one of those is measurable before it becomes a headline, and a good framework measures them on purpose.
A program that can't decide has already begun to slip
Delivery and governance asks whether the program is moving and deciding. The workhorse is the Schedule Performance Index from earned value, earned work divided by planned work, with 0.90 as the line you don't want to cross. Next to it sits milestone hit rate, measured against the baseline dates. Dates you quietly reset last month don't count.
The one I trust most is decision aging. Count the decisions open past 14 days and track the average days to decide. The Standish Group's work on decision latency makes the case that the interval matters more than the elegance of the decision: programs that decide in days beat programs that decide in weeks. An aged-decision list, reviewed oldest first, predicts trouble earlier than any schedule metric I know, because a program that can't decide has already begun to slip. It just hasn't shown up in the plan yet.
Past 20% complete, the cost index rarely recovers
Financial asks whether spend is buying real progress. The Cost Performance Index, earned value over actual cost, uses 0.90 as the warning line too. Decades of earned value research on large government programs carry a hard lesson: once a program passes roughly 20% complete, the cumulative CPI rarely recovers. If you're over budget at the one-fifth mark, the honest base case is that you finish over budget, so the intervention has to happen now, while the math is still open.
The number I watch even more closely is burn against accepted deliverables, which is budget spent against work the client has formally accepted, whatever the calendar says. When burn leads acceptance by ten points or more, you're paying for progress nobody has proven. That gap is the financial watermelon.
The view programs fund last and regret first
People and adoption asks whether the organization is actually coming with you. Prosci's benchmarking is blunt about the stakes. Programs with excellent change management run on or ahead of schedule about five times as often as programs with poor change management, and hold budget about one and a half times as often. All of that upside sits in the one workstream that gets raided for budget when things get tight, and Panorama's data shows fewer than a quarter of organizations put an intense focus on change management.
The KPIs here are training completion by role, weighted toward the go-live-critical roles instead of a flattering all-user average, super-user coverage per site, and wave readiness against gate criteria at set intervals before each cutover. Track completion for what it is, though. It measures exposure. Utilization and proficiency after go-live are the numbers that tell you whether the training took.
Data problems found in user testing are the expensive kind
Data and quality asks whether what you're moving is fit to run a business on. Two field numbers have held across programs I've seen. On a recent conversion, about 10% of the "active" worker records were duplicates or carried termination dates that contradicted payroll history. Call that a spreadsheet problem and you've mislabeled it: it's payroll tax and compliance exposure riding into the new system. On another, 400 "critical" legacy reports collapsed to 90 once we checked them against the actual run logs. Nobody asked for the missing 310 again.
The KPIs are duplicate rate on priority objects, migration rehearsal variance and UAT exit quality. My rule on rehearsals: run at least three full mock loads, and by the final one you want under 2% error overall, with Finance reconciling control totals to the dollar. I treat these thresholds as exit criteria.
Nobody benchmarks your integrator, so you have to
SI performance asks whether your integrator is earning the invoice. It's the view that never appears on the vendor's own status slide, which is exactly why it belongs on yours. Be honest about the evidence here. There's no published industry benchmark for first-pass deliverable acceptance, rework rates or consultant turnover on implementations, and no analyst tracks them. Because no one benchmarks it, the client has to instrument it.
Track first-pass acceptance, the share of deliverables accepted without rework. Track change-order velocity, SI-originated changes per month in count and dollars, and watch for the acceleration that means requirements gaps are being monetized. Track key-person turnover against the named roles in the contract. And track billed against accepted, because when billing runs ahead of acceptance, you're financing the SI's optimism.
Where the lines come from: the 0.90 lines on both performance indices and the 20% rule come from decades of earned value research on large government programs. The four SI thresholds come from my field judgment across many programs, since there's no study to take them from. Treat them as a starting position and tighten them to your context.
Most steering committees won't hold 29 numbers in their heads
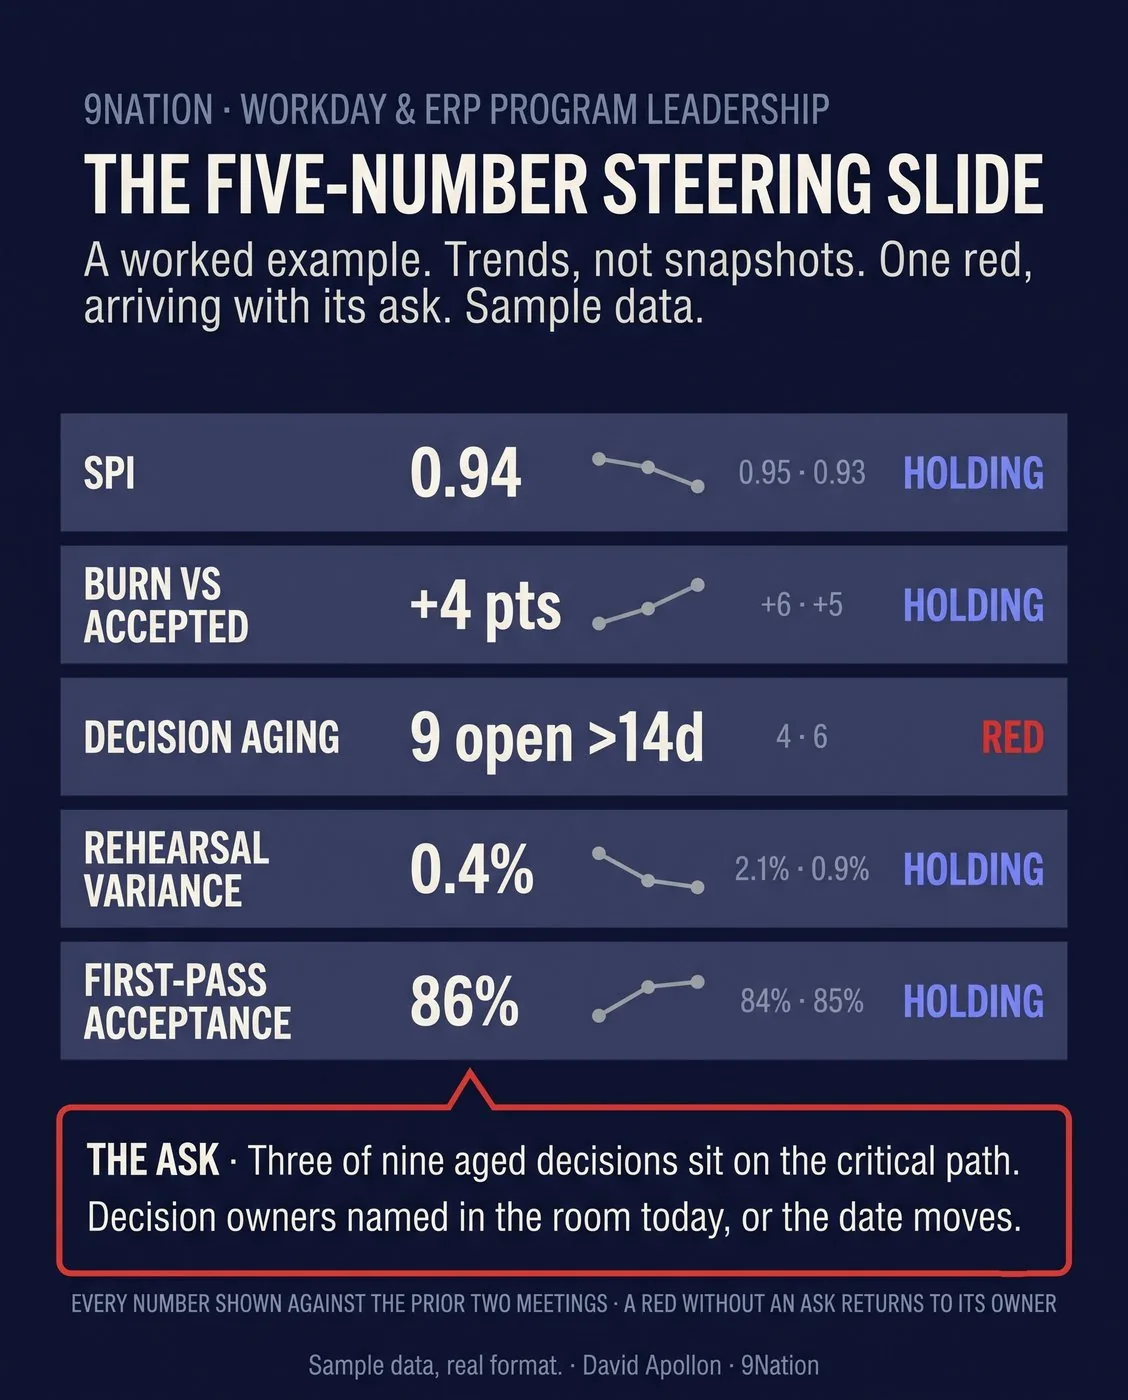
Twenty-nine KPIs is the full instrument, and a steering committee doesn't need to carry all of them. If I had to put five on one slide and make them the spine of every meeting, it would be these, one from each view.
- Schedule Performance IndexIs the program moving?below 0.90
- Burn against accepted deliverablesIs spend buying proven progress?ahead by 10 points
- Decision agingIs the program deciding, or quietly stalling?open past 14 days
- Migration rehearsal varianceIs the data fit to go live on?over 2%
- First-pass SI acceptanceIs the integrator earning the invoice?a falling trend
There's no place for a watermelon to hide across all five at once.
The other question executives ask is which numbers matter right now. The instrument changes by phase. The KPIs that run a design phase aren't the ones that run a cutover, and every phase, from Phase Zero through design, build, test and data, then cutover and go-live, to hypercare and business as usual, has a gate that ends it.
At go-live the KPIs change shape
Everything above measures whether you'll get to go-live in one piece. The day you cut over, the questions change and so do the metrics. Delivery KPIs go quiet. Operational KPIs take their place, and they move by the hour instead of by the week. A program's real health shows up here faster than any status deck can keep up with. I've spent some of the most useful hours of my career in this phase, running a command center for a $25M Workday big-bang across HCM, Finance, Supply Chain and Payroll.
Before go-live you're asking whether you're ready. After go-live you're asking whether it's working, right now, for real people doing real work. The command center answers that on a daily scorecard, triaged several times a day in the first week and daily after that, from one queue with one set of priorities.
Most programs forget to change the instrument. They keep reporting delivery metrics into a period where delivery is over and stabilization is the only question.
Incident volume and aging
The spine of the command center is the ticket picture, pulled from your service management platform, ideally the one you already run the enterprise on. Watch total volume by severity, resolved and open, then the aging buckets that matter most: open past 24 hours, past 72 hours and past 7 days. The 7-day band is the one exit gates watch. Break it down by site and by functional area so a single struggling location or module shows up as a shape before it turns into a surprise. On the big-bang I mentioned, the command center opened first for time and scheduling, then expanded to HR, payroll, finance and supply chain as each went live. The ticket tags by functional area told us where to move people days before anyone raised a hand.
Resolution quality over raw speed
Mean time to resolve is the obvious one, total resolution time over tickets resolved. The one people forget is reopen rate, reopened tickets over resolved tickets. Below 5% is a healthy signal that fixes are sticking. A rising reopen rate during hypercare is worse news than raw volume, because you're closing tickets that reopen and the backlog you think is shrinking is about to come back. Set your severity SLAs tighter for hypercare than for steady state, and time acknowledgment separately from resolution so a fast-triaging command center isn't judged as if every fix were instant.
Adoption, measured for real
At go-live, adoption stops being a training statistic and becomes a login and usage fact: active users, web and mobile, by role and by site, doing real work in the system. Logging in once doesn't count. Prosci is refreshingly honest that there's no universal benchmark for a "good" adoption rate, so be skeptical of anyone who quotes you a magic 95%. What matters is the trend and the outliers. A department far below the others is a change management signal, and it's cheaper to fix in week one than in month three. Watch transaction throughput against the pre-go-live baseline too. If volume is far below normal, users have found a way around the system.
Transaction success, by process
This is where go-live proves itself or doesn't. The metrics translate across every system because they follow the business process.
- Procure to pay
- The three-way match exception rate, and the touchless or straight-through rate on invoices. The top AP teams run exception rates near 9% against an industry average around 22%, and Ardent Partners puts touchless processing at its top performers at roughly half of all invoices, with the average buyer closer to a quarter. At go-live, watch the clean-match rate trend. A sharp drop below the legacy baseline usually means a match-tolerance or master-data problem, and only rarely a user problem.
- Record to report
- The first month-end close on the published calendar. Expect it to run long. APQC's benchmarking puts the median monthly close at about 6.4 calendar days, with top performers under 4.8 and laggards past 10, so a first close that overruns is normal. Success shows across the first three closes as a declining pain curve.
- Order to cash
- Order-entry accuracy, invoice generation success and cash-application match rate. Early breakage here hits revenue and customers faster than anywhere else, so it gets watched first.
- Payroll
- The least forgiving event in the entire program. Two numbers matter. The first is the clean net-pay match rate across the parallel runs, where you want as close to every employee inside tolerance as you can get across at least two consecutive clean cycles. The second is an on-time, accurate first live payroll. A 99% accuracy target across all pay elements is the working standard most teams hold, and any single employee's net pay moving more than about 10% period over period earns a manual review before the run releases. No metric on the program is visible to more people than the first paycheck being right.
Defect leakage and data integrity
Escaped defects, defects found in production over total defects, is the cleanest read on how good your testing actually was. Under 5% leakage is the working target. A spike in high-severity escapes into hypercare tells you the problem sat in UAT scope or test environments, so don't blame your support team for it. Underneath it all, keep reconciling. Post-migration opening balances must equal legacy closing balances, to the penny on financials. Suspense and clearing accounts used during migration have to return to zero, and climbing unposted or suspense transactions are the earliest hard signal of a mapping or interface defect. Watch them daily. By month-end it's too late to do anything but explain.
Exit on conditions
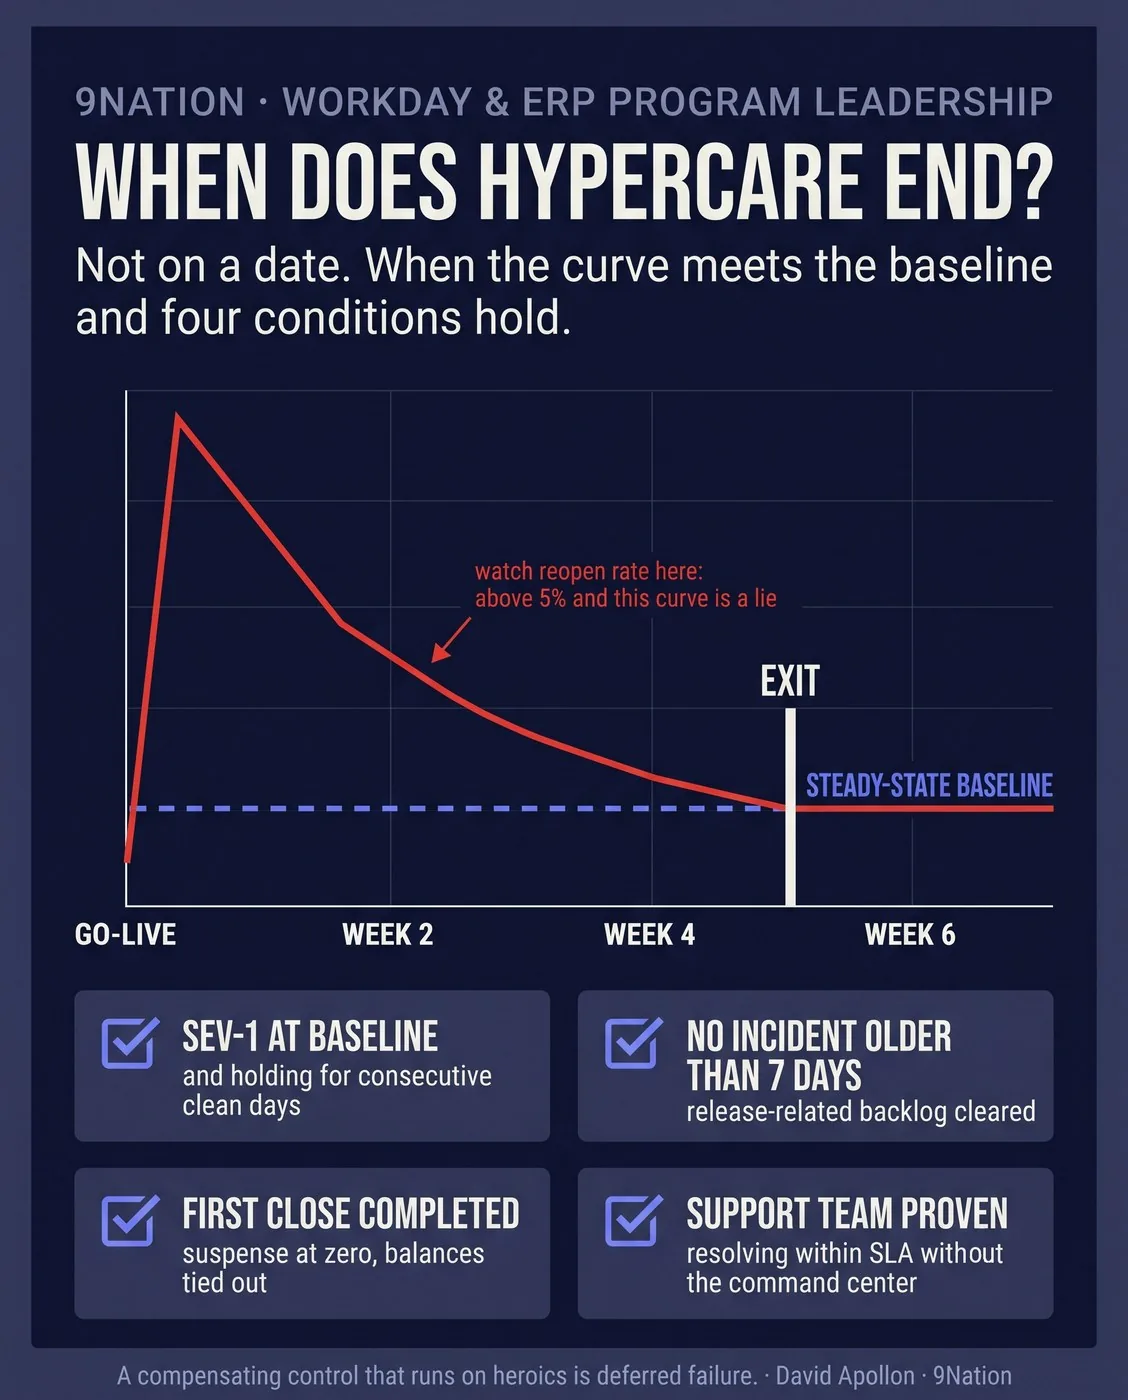
The most important discipline in hypercare is knowing when it ends, and the answer is never a date. Hypercare ends when the operating model can absorb issues through normal support, whether or not the calendar says the 4 weeks are up. Define the exit criteria before you go live and make them measurable:
- Severity-1 volume back to the steady-state baseline
- No release-related incidents older than 7 days
- Several consecutive clean days with no new critical issues
- The first close completed
- The ongoing support team showing it can resolve within SLA on its own, which is the one people skip
Gate the handoff to business as usual on that last proof. Ticket counts alone won't carry it. A compensating control that runs on heroics is deferred failure with a nicer name.
Metrics without a meeting are a spreadsheet nobody opens
The framework earns its keep in a 60-minute steering meeting run on a few rules that don't bend.
- Trends beat snapshots. Every number is shown against the prior two meetings, never as a single point-in-time color.
- Decisions carry an age. They're logged with one and reviewed oldest first, because the aged-decision list is the meeting itself.
- Every red or amber arrives with a written ask: the specific decision or resource that turns it. A red without an ask goes back to its owner.
- The SI presents in the same format, with their deliverable acceptance and change-order numbers sitting right next to yours.
- No slide restates status. If it isn't a number, a decision or a risk, it isn't in the room.
Each view has a question that opens the conversation, and the question is the fastest way to find the watermelon.
- Delivery
- Which decisions older than 14 days sit on the critical path, and who closes them this week?
- Financial
- Show me burn against accepted deliverables. The calendar doesn't count.
- Adoption
- Which go-live-critical roles aren't at 100% training, by site?
- Data
- What was the variance on the last full mock load, and who dispositioned each item?
- SI
- What share of deliverables passed first time, and what's been billed that we haven't accepted?
Each of those questions is built so nobody can answer it with a color. You either have the number or you don't, and not having it is the finding.
Anything you can't produce a number for within 48 hours is a finding in its own right.
A program that measures can't be surprised the way the color-coded ones are
The red shows up while there's still budget, time and scope to move it, long before the week of go-live when all three have run out. On a program betting tens of millions on getting this right, truth that arrives early is the only kind that helps.
The systems will keep changing and the vendors will keep shipping. A status deck will still tell a room full of executives, quarter after quarter, that everything is fine. Build the instrument that lets you check, and you'll know which side of the Gartner number you're on long before go-live tells you for free.
The ERP Program KPI Command Deck
The full 29-KPI catalog with formulas, red-flag thresholds, owners and the 60-minute meeting agenda. Free, no form, along with the rest of the field guides in the toolkit.
Related reading: The steering committee that earns its hour · The watermelon status report · Running a go-live command center that works · Hypercare. Related case study: An end-to-end enterprise Workday program, where this command-center scorecard ran a multi-wave go-live.
Put independent eyes on your program.
If you're betting tens of millions on an ERP program, a candid second opinion is the cheapest insurance you'll buy.